Introduction
Farmers markets are thriving across the United States — as of 2019, the USDA documented 8,140 markets nationwide with an average of 25 vendors per market. But despite this growth, many small-scale food and specialty vendors walk away each week uncertain of what they earned, which products sold best, and whether the day was actually profitable.
Tracking sales sounds simple — count the cash, check the card reader, call it done. In practice, accuracy varies widely based on the method used, how consistently vendors capture data, and whether those numbers ever translate into better decisions.
This guide walks through a practical, step-by-step system for tracking farmers market sales, the tools and habits needed, which metrics matter most, and the common pitfalls that cause vendors to misread their own performance week after week.
Key Takeaways
- Set up your item list, pricing, and recording method the night before market day
- Record each sale as it happens—not from memory at day's end
- Pick a tracking method—tally sheet, app, or POS—that fits your volume and comfort with technology
- Reconcile cash counted against sales recorded at close of day to catch errors
- Review data weekly to decide what to bring more of and which markets turn a profit
How to Track Sales at a Farmers Market: Step-by-Step
Step 1: Set Up Your Tracking System Before Market Day
Preparation the night before determines the accuracy of your entire day's data. Write out or configure every product you plan to bring, its price, and the quantity you're loading.
This pre-market inventory count documents how many units you're taking. Subtract what's left at the end to calculate sell-through — especially useful when you sell out too fast to track individual sales.
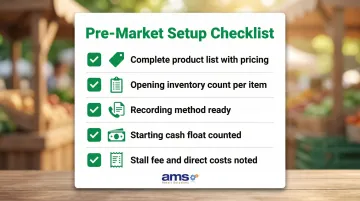
Your setup checklist should include:
- Complete product list with current pricing
- Opening inventory count per item
- Recording method ready (tally sheet printed or app loaded and tested)
- Starting cash float counted and documented
- Stall fee and direct costs noted for profit calculation
Step 2: Record Every Sale During the Market
The two primary in-the-moment options are a physical tally sheet (one row per product, one mark per sale) or a digital method like a mobile POS or sales app where you tap each item sold. Real-time recording is far more accurate than reconstructing sales from memory at the end of the day.
Whichever method you choose, consistency matters more than sophistication.
What to capture at the time of each sale:
- Item(s) sold and quantity
- Price charged
- Payment method (cash, card, EBT/SNAP token, check)
Payment type data becomes essential for end-of-day reconciliation and tax purposes. If you're staffing your booth alone during busy periods, the simplest viable method beats a perfect method you abandon—choose a system that can keep up with your pace.
Step 3: Reconcile Cash and Payments at Close of Day
Once the market closes, reconciliation is your first task — this is where you catch errors before they compound. Count your cash drawer, tally card receipts or processor totals, and add any EBT/token redemptions. Compare that figure against what your tally sheet or app recorded as total sales.
When the numbers don't match:
- Look for missed tallies or unrecorded transactions
- Check for split payments (part cash, part card)
- Review any refunds or voids that weren't logged
- Note the discrepancy amount and investigate patterns to improve your system
Small discrepancies are normal, but consistent gaps signal a problem with your recording method or process.
Step 4: Review and Log Your Data After the Market
Transferring data into a running record — even a simple spreadsheet with columns for date, market location, item name, units sold, revenue, and payment type — turns single-day snapshots into seasonal trends you can act on over a season.
Establish a weekly review habit:
- Compare this market's totals to the previous week
- Review which items are trending up or down
- Identify products that sold out versus came back unsold
- Adjust your next load-out based on sell-through rates
- Track which markets deliver the best returns
Vendors who review this data weekly can spot underperforming products early, shift inventory before the season turns, and build a realistic picture of which markets are worth their time and fees.
What You Need Before You Start Tracking Sales
The right setup—even a simple one—prevents the two most common failure points: forgetting to record during the rush and losing paper records before you can transfer them.
Equipment and Tools
Basic setup:
- Pre-printed or handwritten tally sheet per market day (with each product listed)
- Pen or pencil (bring backups)
- Simple cash box with starting float
- Method to separate payment types (envelopes, dividers, or rubber bands)
Advanced setup:
- Smartphone or tablet with POS or sales app loaded and tested
- Card reader (if accepting card payments)
- Portable charger or backup battery
- Weather protection for devices (waterproof case or cover)
Records to Prepare in Advance
Once your gear is ready, turn to your paperwork. Your pre-market prep checklist should include:
- Product list and prices confirmed in your system
- Opening inventory count documented per item
- Stall fee and direct costs noted (fuel, packaging, ice)
- Starting cash float counted and recorded
Documenting costs before you leave allows you to calculate actual profit, not just revenue, when you reconcile at day's end.
Key Sales Metrics Every Farmers Market Vendor Should Track
Raw sales totals alone tell you very little. Breaking that data into specific metrics reveals whether your business is growing, which products earn their spot in your cooler, and whether a given market is actually worth the drive.
Total Gross Sales per Market Day
Tracking total revenue per market, by location, allows you to rank your markets by performance and compare the same market across weeks and seasons. This helps you decide where to invest more time and inventory. Regional studies show wide variation—one Washington State survey found market-level annual sales ranging from $1,000 to $5,000,000. Track your own numbers — averages won't tell you where you stand.
Sales by Item or Product Category
roughly 1 in 5 items you paid to grow, pack, and transport — with no return.
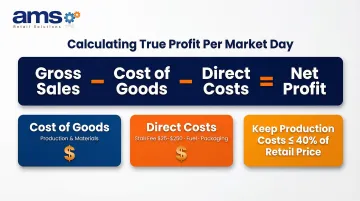
Estimated Profit per Market Day
Profit equals gross sales minus cost of goods sold and direct costs (stall fee, fuel, packaging). Tracking this per market prevents the common trap where a vendor has a "great sales day" that still lost money once expenses are accounted for. For value-added foods, a rule-of-thumb is to keep production costs at 40% of retail price. Direct costs vary widely—stall fees can range from $25 per day to $250 per week depending on market and season.
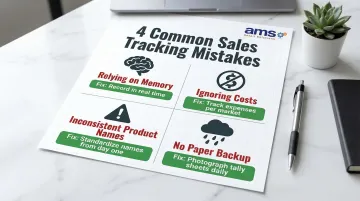
Common Mistakes Vendors Make When Tracking Sales
Most vendors make the same four tracking errors — and each one quietly distorts the business data you rely on to make decisions. Here's what to watch for:
Relying on Memory or a Single End-of-Day Total
Estimating or summarizing sales at the end of a busy market instead of recording in real time means you'll undercount items sold, miss payment types, and end up with data you can't trust. While many markets recommend end-of-day vendor sales slips, this method depends on recall. Research on street vendors lists "recall bias" as a primary limitation of self-reported income data.
Tracking Revenue but Ignoring Costs
Logging sales without subtracting cost of goods, stall fees, and travel creates a false picture of profitability. A vendor may generate consistent revenue but lose money at certain markets without knowing it. Calculate your true costs per item and per market day to understand which locations and products actually contribute to your bottom line.
Inconsistent Product Naming or Categories
Using different names for the same item across weeks creates comparison problems that compound over time. For example, "cherry tomatoes," "pint tomatoes," and "tomatoes – small" all refer to the same product but will show up as separate line items in your records. Standardize names from day one:
- Pick one name per product and never deviate
- Apply the same naming convention to inventory counts and sales records
- Review your list at the start of each season to catch inconsistencies before they multiply
No Backup for Paper Records
A single tally sheet lost to rain, wind, or a spilled water bottle means the day's data is gone. That risk is more common than most vendors expect — the SBA Office of Advocacy reports that 42.9% of nonemployer businesses were in counties impacted by natural disasters annually between 2017 and 2021. That risk applies to paper records too. The University of Arkansas System Division of Agriculture recommends photographing paper records and storing them digitally. Take a photo of your tally sheet at end of day before storing or transferring it.
Choosing the Right Sales Tracking Method for Your Setup
The best sales tracking method is the one you will actually use consistently. The right fit depends on your product count, transaction volume, tech comfort level, and whether you accept cards or EBT.
Manual Methods (Tally Sheets and Before/After Counts)
Best for: Vendors with a small, stable product list, cash-only operations, or beginners building the tracking habit.
Two approaches:
- Before/after inventory count: Count items loaded, subtract items returned at day's end. Simple but provides no detail on when items sold or payment methods used.
- Tally-per-sale method: One row per product, one mark per sale as it happens. Requires discipline during busy periods but captures more detail.
Both methods are low-cost but limited in the detail they capture and require manual data entry for long-term tracking.
Mobile Apps and Digital Sales Tools
Smartphone-based POS apps like Square or Shopify let vendors tap items to record a sale, automatically calculate totals, accept cards, and export sales reports. Transaction fees typically range from 2.4% to 2.7% plus $0.05 to $0.15 per transaction, depending on the plan.
Tradeoffs to consider:
- Per-transaction fees versus time and accuracy saved
- Requires reliable device battery (bring backup power)
- Weather protection needed for outdoor use
- Best for vendors with 10+ SKUs or those accepting card payments
A 2023 Farmers Market Coalition survey found that 44% of markets processing SNAP/EBT used mobile apps, though this often reflects market-level rather than individual vendor adoption.
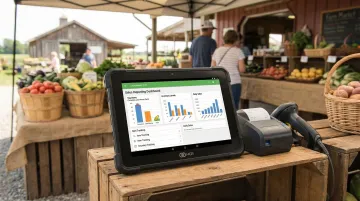
Dedicated POS Systems for Farm Markets
Vendors who operate at multiple markets, carry large product catalogs, or accept EBT/SNAP benefit most from a purpose-built retail POS. Unlike basic apps, these platforms track sales by item, payment type, and market location — letting you see exactly which booth brought in the most revenue on any given Saturday.
NCR Voyix Counterpoint, available through AMS Retail Solutions, is built specifically for farm markets and specialty retailers. It runs on mobile hardware so vendors can process sales from any stall or booth, with support for card payments and EBT. Key capabilities include:
- Automatic inventory deduction at the point of sale
- Sales reporting by market location and product
- Load-out optimization based on historical sell-through data
- Offline POS capability if the network goes down
For farm market vendors managing multiple locations or a large product catalog, this level of detail pays for itself quickly. Contact AMS Retail Solutions at 757.495.4995 to learn more.
Frequently Asked Questions
Frequently Asked Questions
How to track sales at a farmers market?
The most reliable method is to record each item sold in real time using a tally sheet, mobile app, or POS system, then reconcile total payments at end of day and log data into a running spreadsheet after each market. Real-time recording prevents the recall bias that undermines memory-based reporting.
What is the best app or tool to track farmers market sales?
Beginners do well with a tally sheet or free spreadsheet; growing vendors benefit from mobile POS apps like Square; higher-volume or multi-market operations often need a dedicated retail POS system. Match your tool to your product count, transaction volume, and accepted payment methods.
Do farmers market vendors need to track cash sales separately from card sales?
Yes, tracking payment methods separately matters for accurate end-of-day reconciliation, proper income reporting, and—if accepting SNAP/EBT—compliance with federal recordkeeping requirements that mandate three years of transaction records including payment type details.
How do I use sales data to decide what to bring to the next market?
Compare units sold to units brought (sell-through rate) to see what sold out versus what came back. Fast sellers warrant larger quantities; slow sellers may need repricing, rebundling, or removal. Base decisions on multi-week trends, not a single day's results.
What records do I need to keep for tax purposes as a farmers market vendor?
Keep records of gross sales per market day, itemized expenses (cost of goods, stall fees, transportation), and payment type breakdowns. Most vendors report income on Schedule C (Form 1040) and owe self-employment tax when net earnings exceed $400. Check your state's rules on sales tax for categories like prepared foods.
How do I track inventory at a farmers market booth?
The simplest approach is a pre-market count of every item loaded and a post-market count of what came back, with the difference equaling units sold. More advanced apps and POS systems automate this by deducting inventory as each sale is recorded, showing exactly what's selling and what remains.